Address
304 North Cardinal St.
Dorchester Center, MA 02124
Work Hours
Monday to Friday: 7AM - 7PM
Weekend: 10AM - 5PM
Address
304 North Cardinal St.
Dorchester Center, MA 02124
Work Hours
Monday to Friday: 7AM - 7PM
Weekend: 10AM - 5PM
The client operates within the IoT industry and is managing a growing network of sensors and infrastructure to collect vast amounts of data on a schedule from thousands of endpoint devices in the field. This time-series data is stored in a central database for further analysis and monitoring. While the client has dashboards and visualization tools to access this data, analyzing it to uncover insights is mostly a manual process undertaken by their team. With years of accumulated historical data from their expanding network of sensors, it has become an increasingly difficult and time-consuming task for analysts to dig through information to detect abnormalities or emerging patterns. Without a way to rapidly explore both real-time and historical data at scale, issues can be easily missed until they might escalate significantly.
The reliance on manual analysis and exploration of the sensor data carries significant challenges for the client’s team. Scanning huge sets of time-series data visually for anomalies or errors is impractical and ineffective given the volume of information from thousands of devices. Even when alerts are raised about potential problems, attempting to lookup related historical data to investigate the issues further requires significant effort.
Additionally, the opportunity to leverage the full depth of the data to derive operational insights using statistical analysis, machine learning, or AI is mostly untapped given these manual limitations.
To better address the client’s needs, our first step was to engage in a comprehensive consultation with their team. This collaboration allowed us to gain a deep understanding of the business context, the specific challenges faced, and the intricacies of the existing system. With a clear picture of the client’s requirements, we crafted an action plan designed to maximize the value delivered through the project.
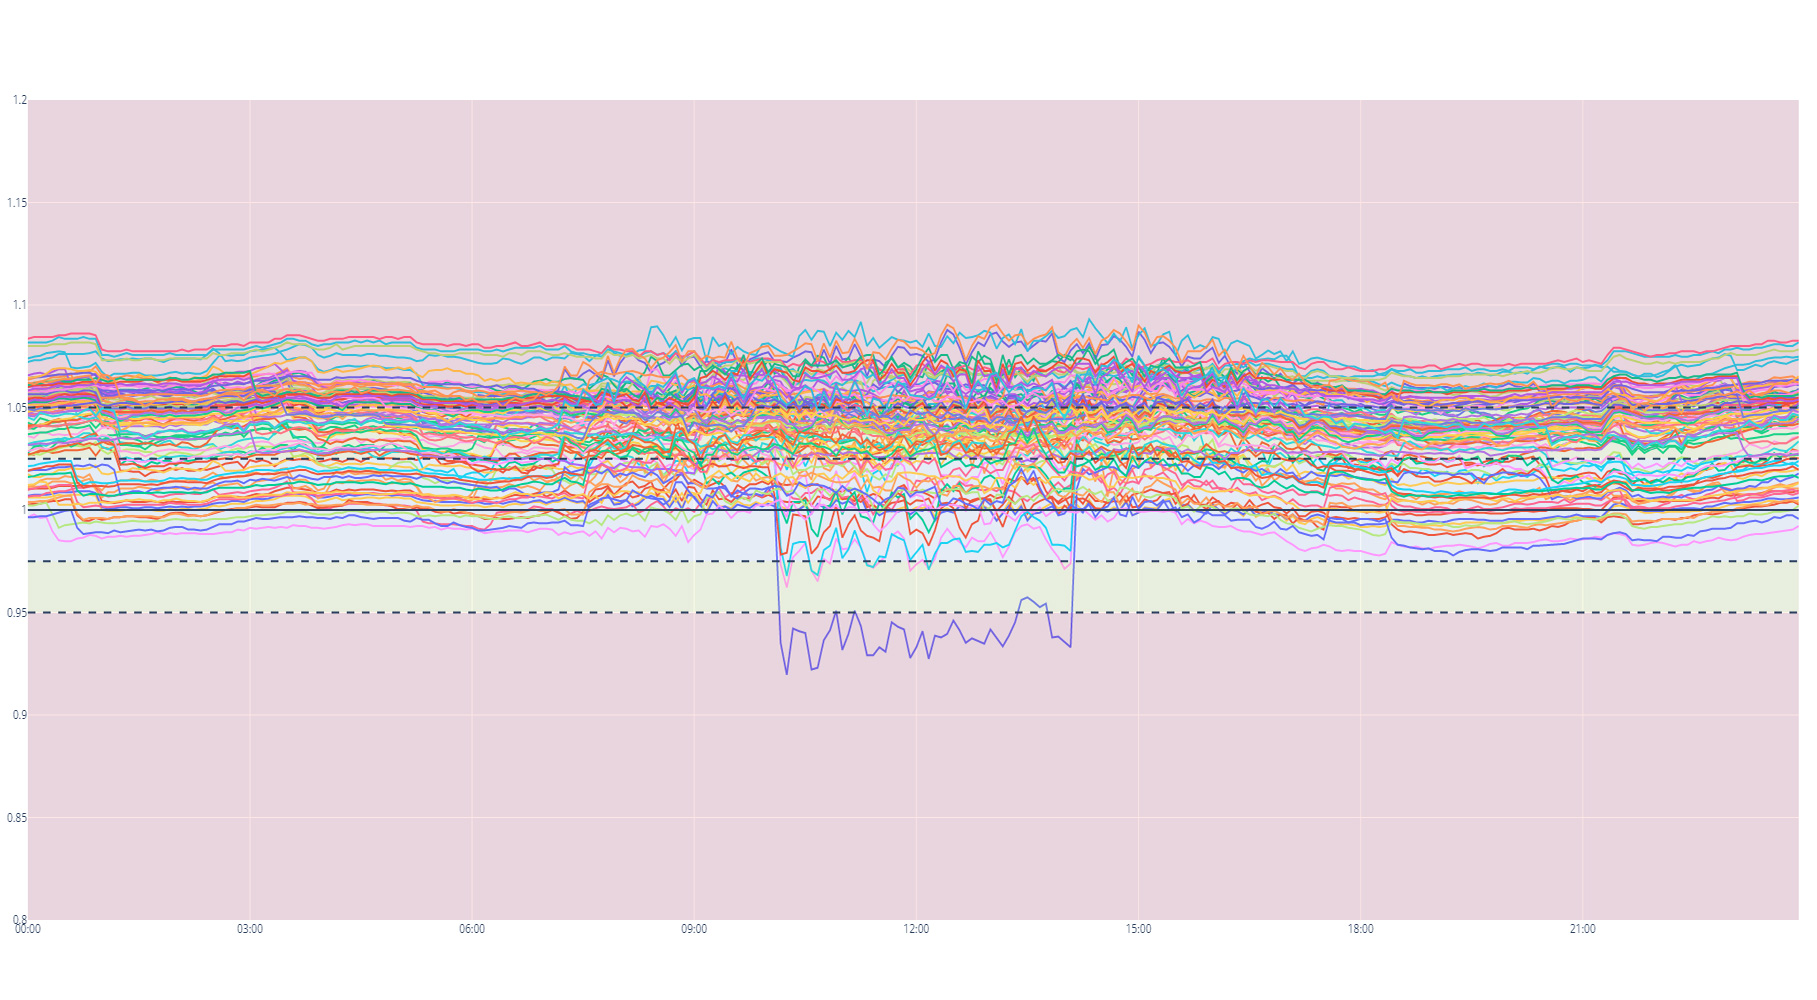
This plan outlined a multi-phased approach, beginning with a thorough analysis and visualization of a few selected data sets. This allowed us to pinpoint a few of the various data issues we were looking for and provided the examples needed in our development process. This led us to the second phase, where our team developed a series of algorithms ranging from simple gap analyses to complex anomaly detection, each employing a variety of statistical methods to analyze the central tendencies and deviations within the data. These algorithms are easily adjusted through a series of parameters recorded in a configuration file. This approach provided the client with the ability to easily fine tune the models to adapt to evolving data trends or business needs.
As the next step, the infrastructure to support automatic batch processing of data was put in place. This system iterated through the daily data datasets, applying the predefined models to search for and flag any irregularities. The output of this process was a CSV file, detailing all anomalies and patterns of interest. The format of this file was customized to dovetail with the client’s in-house tools, facilitating a smooth transition and immediate integration.
The customized analytics solution delivered impactful outcomes across several dimensions for the client – enabling more efficient use of resources, faster anomaly detection, and unlocking value from previously untouched data.
Additionally, with the new modular architecture now established, the client can easily append or modify algorithms to take on new analysis tasks as needs evolve – without extensive setup time.